 Data Download
This section provides downloadable data sets used or generated by the ASAP system. In addition to the data available for download on this page, background information on the ASAP system and its methodologies can be found on the About ASAP page. For access to other data sets that are part of the ASAP system, or for additional information on the data listed below, please contact us. When using data downloaded from this webpage, please cite the source or other sources possibly indicated in the data description.
ASAP Hotspots
Monthly identification of agricultural production hotspot countries and summary narratives for agriculture and food security analysts. The historical hotspot time series is available in .csv format. To visualize the information in a GIS environment, use the field asap0_id and join with the spatial layer gaul0_asap (see section Administrative Boundaries). The latest ASAP hotspot layer can also be downloaded as shapefile directly from the ASAP homepage and is available as WFS/WMS
hotspots_ts.zip 
Historical data set in .csv format with the time series of all ASAP hotspot assessments since October 2016 (to date)
hotspots_html_ts.zip
Historical data set in .csv format with the time series of all ASAP hotspot assessments since October 2016 (to date), with "comment" column as HTML
ASAP Warnings
10-day automatic warning about crops and rangelands conditions, at the 1st and 2nd sub-national level. The historical time series is available in .csv format. To visualize the information in a GIS environment, use the field asap1_id or asap2_id and join with the spatial layer gaul1_asap or gaul2_asap (see section Administrative Boundaries). The latest ASAP warning layer can also be downloaded as a shapefile directly from the ASAP Warning Explorer page and is available as WFS/WMS
warnings_ts.zip
Historical data set in .csv format with the complete time series of ASAP warnings (crop and rangeland) at 1st sub-national level since last dekad of May 2001 (to date)
warnings_l2_ts.zip
Historical data set in .csv format with the complete time series of ASAP warnings (crop and rangeland) at 2nd sub-national level since last dekad of May 2001 (to date)
HOW TO CITE: Rembold, Felix (2018): Ten-daily automatic warnings about agricultural vegetation anomalies. European Commission, Joint Research Centre (JRC) [Dataset] PID: http://data.europa.eu/89h/jrc-10112-10001
WFS and WMS
The latest ASAP warnings and hotspots can be visualized directly in a GIS desktop environment (e.g. QGIS or even, with some limitations for WFS, ESRI ArcGIS) as WFS and WMS, using the following URL:
https://agricultural-production-hotspots.ec.europa.eu/public/ows?
wfs_hotspots_notes.txt
Description of the fields in the WFS layer HOTSPOTS
wfs_warnings_crop_notes.txt
Description of the fields in the WFS layer WARNING_CROP
wfs_warnings_rangeland_notes.txt
Description of the fields in the WFS layer WARNING_RANGELAND
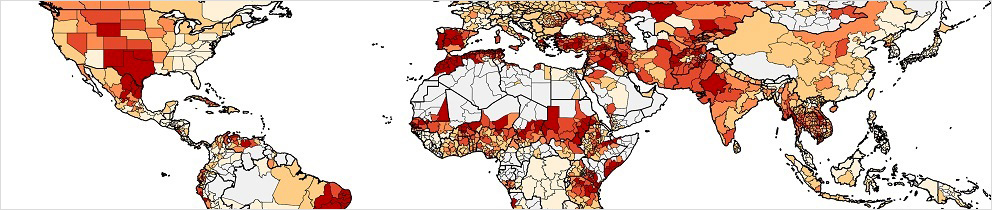
Historical ASAP warning frequency
The 2 maps show the historical frequency of ASAP warnings of level 2 or higher at the sub-national level and can be interpreted as sensitivity to "agricultural drought conditions". The color intensity is proportional to the frequency of ASAP warnings, i.e. the percentage of dekads with a warning, out of the total number of active dekads in the period 2003-2022.
frequency_crop_v08_1.png 
Frequency of crop warnings
frequency_rangeland_v08_1.png 
Frequency of rangeland warnings
Administrative Boundaries
ASAP information is provided at two spatial levels: national (Gaul0) and sub-national (Gaul1). In particular, hotspots are related to national units while warnings to sub-national units. An additional more detailed sub-national level (Gaul2) is available for a set of selected countries of interest, for which we provide aggregated statistics (see "Indicator Statistics" sub section). The reference spatial layers (gaul0_asap, gaul1_asap, gaul2_asap) are derived from the The Global Administrative Unit Layers (GAUL) dataset, implemented by FAO within the CountrySTAT and Agricultural Market Information System (AMIS) projects. The original data sets were adapted to match the specific ASAP requirements (e.g. in some countries, the sub-national units were aggregated, in others they were split in smaller units) and the geometry was simplified (e.g. the number of vertex reduced and small islands removed). The geographic and thematic information contained does not imply a policy position of the European Commission. Here you can download the three layers as shapefiles. These layers can be used to visualize the historical time series of Hotspots, Warnings and Indicator statistics (see related sections below). The key fields are asap0_id, asap1_id and asap2_id. Please note that these layers are intended for visualization at a broad scale and due to the simplification of the geometries, the original topology is not always preserved.
gaul0_asap_v05.zip
ASAP national units (shapefile)
gaul1_asap_v05.zip
ASAP sub-national units - level 1 (shapefile)
gaul2_asap_v05.zip
ASAP sub-national units - level 2 (shapefile)
Land Cover Masks
Global crop and rangeland masks at 0.004464285715 deg resolution (about 1/4 square kilometer). Each pixel represents the area fraction of the specific cover (i.e. percentage of the pixel with crops/rangeland). Data ranges between 1 and 100 showing the % value. These layers were generated for ASAP, combining existing data sets (Fritz, S., Lesiv, M., Perez Guzman, K., See, L., Meroni, M., Collivignarelli, F. and Rembold, F., Development of a new cropland and rangeland Area Fraction Image at 500 m for the ASAP system, Publications Office of the European Union, Luxembourg, 2024, doi:10.2760/32935, JRC137153. doi:10.2760/32935). The data sets were last updated on 01-12-2023 (version 04).
asap_mask_crop_v04.tif
ASAP crop mask (area fraction)
asap_mask_rangeland_v04.tif
ASAP rangeland mask (area fraction)
Phenology
The mean growing season period is defined by a satellite-derived phenology computed on the long-term average of 10-day MODIS/VIIRS FPAR data. Data preprocessing was done with an improved version of the filtering algorithm of Klisch and Atzberger (2016) starting from MCD15A3H (MODIS), VNP15A2H (Suomi-NPP satellite) and VJ115A2H (NOAA-20 satellite) global data at 500 m spatial resolution.
The following key parameters are retrieved for each pixel: number of growing seasons per year (i.e. one or two); start of season (SOS, occurring at the time at which FPAR reaches 25% of the ascending amplitude of the seasonal profile); time of maximum FPAR (TOM); start of senescence period (SEN, when FPAR drops below 75% of the descending amplitude); and end of the season (EOS, when FPAR drops below 35%).
Phenology timings: the value V in the image is expressed over a 3 years period, from dekads (i.e. ten-day periods) 1 to 108. This is done in order to treat the circular variable "dekad" as an ordinal variable (the mean of SOS cam be computed as the usual average). Example for a season crossing the calendar year:
phenos1 = 30, last dekad of October, phenoe1 = 46, first dekad of April -> T = 46 - 36 = 10
Therefore, to get the timing T in the 1-36 dekad units (calendar year), one can use:
IF V <= 36 THEN T = V
IF 36 < V <= 72 THEN T = V -36
IF V > 72 THEN T = V - 72
phenos1_v04.tif
Phenology: start of the season, first season
phenos2_v04.tif
Phenology: start of the season, second season
phenom1_v04.tif
Phenology: max of the season, first season
phenom2_v04.tif
Phenology: max of the season, second season
phenoe1_v04.tif
Phenology: end of the season, first season
phenoe2_v04.tif
Phenology: end of the season, second season
phenosen1_v04.tif
Phenology: start of senescence, first season
phenosen2_v04.tif
Phenology: start of senescence, second season
phenonseasons_v04.tif
Phenology: number of seasons (1 or 2)
Crop Calendars
The national and sub-national crop calendars are based on FAO data and include only crops for which the original calendars match with the ASAP remote sensing based phenology. The file includes the start and end dekad (over the 36 dekads in a year) of the planting period (sos_s and sos_e), the start and end dekad of the growth period (sos_e and eos_s), and the start and end dekad of the harvest period (eos_s and eos_e). The rest of the year is considered out of season. To visualize the information in a GIS environment, use the field asap1_id and join with the spatial layer gaul0_asap (see section Administrative Boundaries).
crop_calendar_gaul0.zip
Crop calendar at national level
crop_calendar_gaul1.zip
Crop calendar at national level
Every 10 days, the ASAP system downloads earth observation and agrometeorological data from various sources and uses this data in various combinations with the historic time series, phenology and crop/pasture masks to produce ASAP specific raster indicators. Below is a list of raster idicators available for download with the link to the their download location and their download filename patterns:
fpar_yyyymmdd.tif
FPAR indicator
mfpard_yyyymmdd.tif
mFPARd indicator
zfparc_yyyymmdd.tif
zFPARc indicator
zfpar_yyyymmdd.tif
zFPAR indicator
fpard_yyyymmdd.tif
FPARd indicator
rfparc_yyyymmdd.tif
rFPARc indicator
rain_yyyymmdd.img
Rainfall 10-days indicator
spi1_yyyymmdd.img
SPI 1 month indicator
spi3_yyyymmdd.img
SPI 3 month indicator
wsi_hp_crop_yyyymmdd.tif
zWSI crop indicator
wsi_hp_pasture_yyyymmdd.tif
zWSI rangeland indicator
sm_combined_yyyymmdd.tif
Soil Moisture (gapfilled historical time series)
Indicator info Web Service
For a more automated, machine to machine, download there is a web service implemented providing more detailed information on available raster indicators, like the download location, resolution and the level of completion (getIndicatorsInfo).
Indicator info service manual
Document describing the usage of the webservice
Indicators description
Below is a description of ASAP indicators available for download:
- FPAR - Fraction of Photosynthetically Active Radiation. FPAR is defined as the fraction of incident photosynthetically active radiation (PAR, spectral region between 400 and 700 nm used by plants to make photosynthesis) absorbed by the green elements of a vegetation canopy. It is closely linked to canopy functioning processes and it is a key biophysical variable for vegetation productivity estimation, terrestrial carbon and vegetation growth condition monitoring. Range = [0 %,100 %]
- mFPARd - [Anomaly] Mean FPAR difference with historical average over the growing season period between the start of sason and the date selected. Note that the mean growing season may start at different time for different pixels
- zFPARc - [Anomaly] Standardized score (Z-score) of the cumulative FPAR over the growing season period (FPARc) between the start of season and the date selected. It indicates how many standard deviations the FPARc is away from its mean value calculated over the same period for all available years (historical average). Note that the growing season may start at different time for different pixels
- zFPAR - [Anomaly] Standardized score (Z-score) of FPAR at the selected date
- FPARd - [Anomaly] FPAR difference with historical average at the selected date
- rFPARc - [Anomaly] Relative difference of the cumulative FPAR over the growing season period (FPARc) with respect to its historical average, expressed in percentage (%).
- Rainfall 10-days - Cumulative rainfall during the 10-day period selected
- SPI 1 month - [Anomaly] Standardized precipitation Index computed with 1-month time scale. The SPI is a probability index that expresses the observed cumulative precipitation for a given timescale (i.e., the period during which precipitation is summed) as the standardized departure from the rainfall probability distribution function
- SPI 3 month - [Anomaly] Standardized precipitation Index computed with 3-months time scale
- zWSI crop - [Anomaly] Z-score of the Water Satisfaction Index for crops (see ASAP Water Satisfaction Index report in the Documentation section of the ASAP website)
- zWSI rangeland - [Anomaly] Z-score of the Water Satisfaction Index for rangeland (see ASAP Water Satisfaction Index report in the Documentation section of the ASAP website)
- Soil Moisture (gapfilled historical time series) - Soil moisture value from C3S, “soil moisture gridded data from 1978 to present” (v202012). Data refers to volumetric soil moisture (m3 m-3), i.e. the content of liquid water in a surface soil layer of 2 to 5 cm depth expressed as m3 water per m3 soil, derived from active and passive satellite sensors combined. Global data at a 0.25° spatial grid and 10-day temporal resolution are made available by C3S with a latency of about 10 days, occasionally larger. Combined means a combination of Soil Moisture and Gapfilled Soil Moisture. SM is gapfilled using seasonal decomposition and gaussain process to estimate residuals. Gpafilled datasets are up to dekad 2024-07-01, after that dekad regular soil mosture continues up to date.
For more datails please refer to the ASAP warning classification scheme v 8.0.
Using ASAP data: Credits and license information
Citation
European Commission: Joint Research Centre, Meroni, M., Rembold, F., Vojnovic, P., Collivignarelli, F., Kerdiles, H., Urbano, F., Garrido Martin, J., Agudo Bravo, L., Dimou, M., Bande, A. and Veiga Lopez-Pena, J.M., The warning classification scheme of ASAP – Anomaly hot Spots of Agricultural Production, v8.0, Publications Office of the European Union, Luxembourg, 2025, https://data.europa.eu/doi/10.2760/6814458, JRC140585.
License
Reuse is authorised, provided the source is acknowledged. The reuse policy of the European Commission is implemented by a Decision of 12 December 2011
Disclaimer
Unless the following would not be permitted or valid under applicable law, the following applies to the data/information provided by the JRC:
- The JRC data are provided "as is" and "as available" without warranty of any kind, either express or implied, including, but not limited to, any implied warranty against infringement of third parties' property rights, or merchantability, integration, absence of latent or other defects, satisfactory quality and fitness for a particular purpose. The JRC data do not constitute professional or legal advice (if you need specific advice, you should always consult a suitably qualified professional).
- The JRC has no obligation to provide technical support or remedies for the data. The JRC does not represent or warrant that the data will be error free or uninterrupted, or that all non-conformities can or will be corrected, or that any data are accurate or complete, or that they are of a satisfactory technical or scientific quality.
- The JRC or as the case may be the European Commission shall not be held liable for any direct or indirect, incidental, consequential or other damages, including but not limited to the loss of data, loss of profits, or any other financial loss arising from the use of the JRC data, or inability to use them, even if the JRC is notified of the possibility of such damages.
Pre-operational Country-level Yield Forecasting with Machine Learning Algorithms and Agrometeorological Data
Country-level yield forecasts are computed for 77 food insecure countries using machine learning algorithms and agrometeorological data. The system is currently in testing phase and utilizes over 20 years of FAOSTAT yield data and ASAP agrometeorological data to provide in-season prediction of crop yields. Remote sensing and meteorological data are used to extract important information about crop development, including maximum NDVI, average temperature, and the sum of radiation and rainfall. Similar countries are grouped together based on their crop development characteristics to improve the accuracy of the models. Finally, only models that achieved Rcv2 > 0.3 were considered suitable for operational forecasts and retained. If no valid model is retained for a given crop-country, no forecast is available.
Forecast model outputs are provided as pdf and csv files and they report: The forecasted yield for the current season, average yield based on the last five years and the percentage difference between the forecasted and the 5 years average yield, input feature combination (RSTR or TR) and the best pooling approach (All, Main or Individual), root mean square error (RMSE) and the coefficient of determination (R2) in prediction from the hindcasting experiments. PDF files also contain plots of observed and predicted yield values (since 2006) as well as the benchmark model (average of last 5 years). Additional information on the methodology can be found in the Methodology summary.
The latest yield forecast can be downloaded from the yield forecast data download page and they are issued 7 days after the forecast is triggered according to calendar below.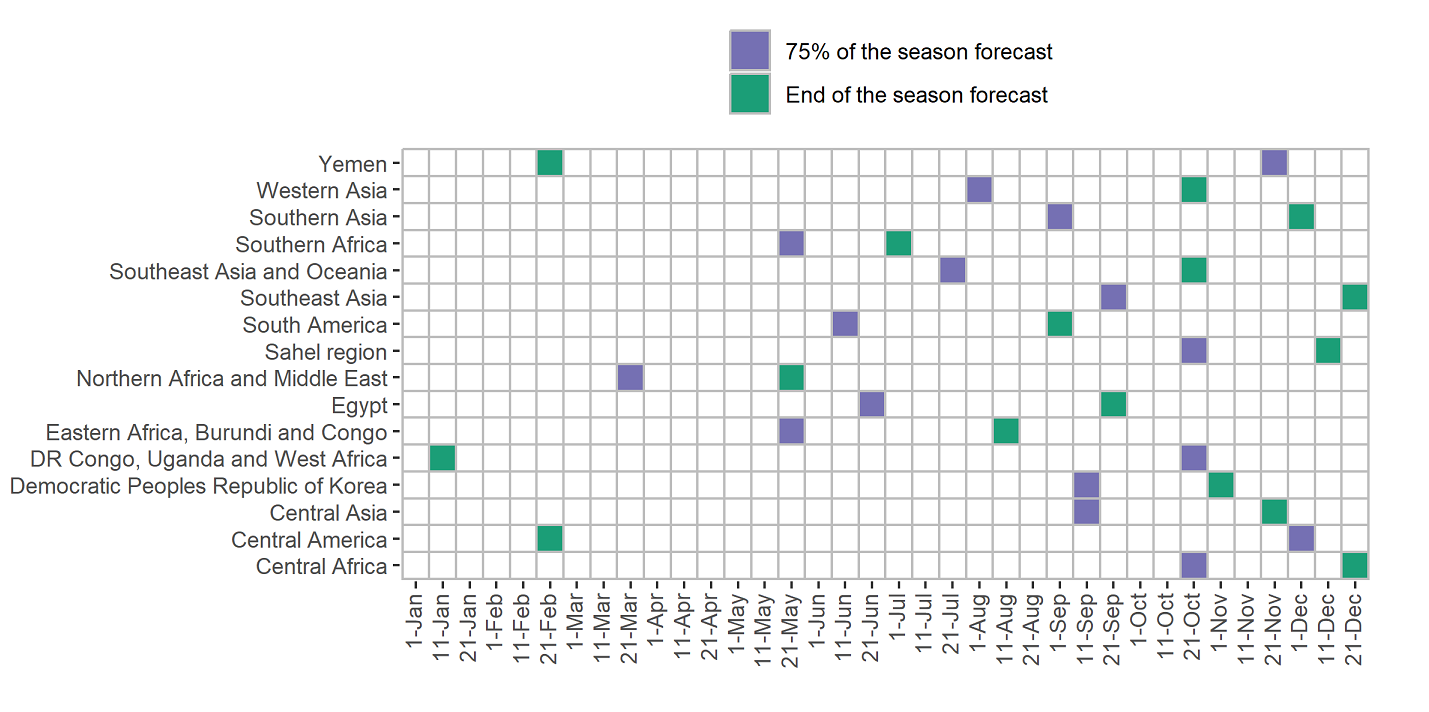
 Software Download
As part of its agricultural monitoring for food security activities, the JRC, in collaboration with external partners, has developed several open access desktop applications. In this section, you can download the image time series processing tool SPIRITS (Software for Processing and Interpretation of Raster Image Time Series) and the yield forecasting tool CST (CGMS Statistical Tool). SPIRITS is used for producing some of the anomaly indicators behind the ASAP warnings, whereas selected ASAP indicators can be used as yield proxies by the CST tool.
Description
SPIRITS (Software for the Processing and Interpretation of Remotely Sensed Image Time Series) was developed by VITO for the Food Security unit of the Joint Research Centre. It is a software environment for analyzing satellite derived image time series for crop and vegetation monitoring in an integrated and flexible analysis environment and with a user-friendly graphical interface. With this toolbox, you can process and examine time series of low and medium resolution sensors. It can be used to perform and to automatize many spatial and temporal processing steps on time series and to extract spatially aggregated statistics. Vegetation indices and their anomalies can be rapidly mapped and statistics can be plotted in seasonal graphs to be shared with analysts and decision makers. This presentation introduces the main features available in SPIRITS. These two papers: Image time series processing for agriculture monitoring and Remote sensing time series analysis for crop monitoring with the SPIRITS software: new functionalities and use examples describe the tool with more details. For additional information, you can read the SPIRITS manual.
Download
SPIRITS Software
Version 1.5.2, February 2018.
Important note: SPIRITS requires a Java virtual machine (JVM) to run. If not already installed, users can download Java version 1.7 or higher.
SPIRITS Manual
User Manual that contains general information on image formats and general concepts on SPIRITS processing. All SPIRITS functionalities are described in detail.
SPIRITS Tutorial
Version 1.1, June 2013. A set of exercises that guides the user step by step to perform the most typical image processing chains for agriculture monitoring.
Tutorial Sample Data Set
A sample training data set needed to replicate the exercises illustrated in the SPIRITS Tutorial.
Ownership and distribution
The European Union is the owner of the copyright and other intellectual and industrial property rights, trade secrets, and know-how related to the Software over which is has the power of disposal regardless geographical or other limitations. Subject to compliance with the terms of this licence, the European Union grants the User a personal, non-exclusive and royalty-free licence to Use the Software and Software Package. See the end-user licence agreement for more details.
Acknowledgments
SPIRITS was programmed by Dominique Haesen and Herman Eerens from VITO. From the side of JRC-MARS the developments were guided by Felix Rembold. In addition, the software further benefited from contributions from various JRC-MARS and VITO researchers, who used the software in their own work or for training sessions in Africa and abroad. The Food and Agriculture Organization (FAO) of the United Nations financially supported the development of a number of additional modules which were specifically developed in the frame of FAO’s Agricultural Stress Index System (ASIS).
Description
CST software is designed to support the development and selection of crop yield forecast models to facilitate national and sub national crop yield forecasting. Time trend analysis of yield statistics is followed by regression or scenario analysis using biophysical indicators to explain yield statistics and search for similar years. Constructed models are used to predict yield of the current growing season.
The CGMS statistical tool has been developed for the MARS unit of JRC in the framework of several MARS related projects (MARSOP, ASEMARS, E-Agri, AGRICAB and SIGMA). These projects contributed to development of the initial version and a number of subsequent updates. The original objective was to support the national crop yield forecasting activities of the MARS Crop Yield Forecasting System (MCYFS). Later, through EU research project like E-Agri, AGRICAB and SIGMA the CGMS statistical tool has been introduced to other (non)-governmental organizations having a mandate in monitoring and forecasting crop production.
CST can be used in connection with SPIRITS to combine image processing with statistical crop yield forecast modelling. A selection of ASAP indicators available in the data download page, can also be used as yield proxies in CST
Download
CST Software
Version 3.5.3, October 2019
CST Manual
User Manual
Ownership and distribution
The European Union is the owner of the copyright and other intellectual and industrial property rights, trade secrets, and know-how related to the Software over which is has the power of disposal regardless geographical or other limitations. Subject to compliance with the terms of this licence, the European Union grants the User a personal, non-exclusive and royalty-free licence to Use the Software and Software Package. The licence is granted for non-commercial purposes only. See the end-user licence agreement for more details.