
Chad

August 2026
Rainfall performance has been highly irregular across Chad, characterized by severe precipitation deficits and high temperatures at the start of the 2026 agricultural season in May, followed by near-average conditions in June, and a return to below-average rainfall and elevated temperatures over the past month. Consequently, both cropland and rangeland biomass conditions remain below-average across most parts of the country. At the national level, approximately 45% of the active crop area and more than 30% of the active rangeland area are affected by a negative greenness anomaly. The most severely impacted areas include the Sudanian regions of Logone Occidental, Logone Oriental, Tandjilé, Mayo-Kebbi Ouest, Mandoul, and Mayo-Kebbi Est, alongside the Sahelian regions of Ouaddaï, Batha and Sila. Compounding these environmental stressors, persistent insecurity remains a primary driver of food insecurity; according to FEWS NET (July 2026), escalating Boko Haram attacks in Lac Province and clashes surrounding refugee disarmament and water access in eastern provinces like Wadi Fira and Ouaddaï continue to create a climate of fear that drives population displacement and severely disrupts local livelihoods. Looking ahead, the Copernicus C3S Multimodel seasonal rainfall forecast for September 2026 predicts near-average conditions nationwide, with the exception of the southern and southeastern regions, which are expected to face drier-than-average conditions.
Assessment_graph
Date
Agricultural cover

Number of administrative units classified as Warning (%)

Date
Cover
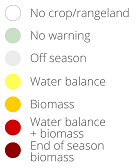
legend warnings
Date
Cover
WI_graph1
Date
Cover
WI_graph2
Date
Cover
Indicator
WI_graph3
Year
Cover
Indicator
Area
ASAP1 Units
Main indicators at dekad
Last 6 dekads for indicator
Date
Indicator
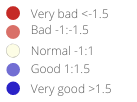
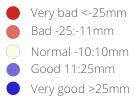
anomaly legend
Date
Indicator
anomaly legend fpar
Date
Indicator
anomaly legend rain
Date
Indicator
anomaly legend rain
Date
Indicator
anomaly legend wetdry
Date
Indicator
anomaly legend wetdry
Phenology
Layer
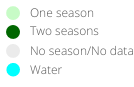
anomaly legend season
Season progress
Dekad
process legend
Agricultural area
Cover
mask legend
Warning frequency map
Cover
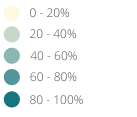
frequency maps legend
ASAP units
Selection of FAO crop calendars matching with ASAP phenology
CCP_graph1
Agriculture statistics: ten crops with largest area
CCP_graph2
Agriculture statistics: ten crops with largest production
CCP_graph3
Share of national cereal production by subnational units
CCP_graph4