Cameroon

September 2024
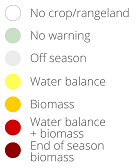
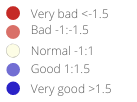
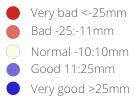
Harvest of millet and sorghum in the north will start at the end of September, and harvest of the main maize crops in central and southern parts started in mid-August and it will be concluded at the end of September. Water stressed vegetation conditions are observed in the Nord region, as a significant rainfall deficit affected the region during the first 20 days of August (ca. 40% below average cumulative rainfall). Rainfall recovered in the Nord region at the end of August, and there was an increase in the crop biomass in the region. In general, cumulative rainfall in the last month has been average to above-average in most parts of the country and below-average in the southwestern part. As a result, in the Nord-Ouest region, ca. 30% of active crop area is affected by a greenness anomaly. Heavy rains since July caused flooding in several localities in five departments in the Far North: Logone and Chari, Mayo-Danay, Diamaré, Mayo-Tsanaga and Mayo-Kani. As of 19 September, at least 365,060 people have been affected by flooding, 82,509 hectares of arable land were flooded and 5,278 heads of livestock were lost (UNICEF, OCHA). According to FEWSNET (August 2024), “the most pressing constraint on agricultural production in Cameroon remains conflict-related declines in area cultivated, currently estimated to be between 20-30 percent in the Far North”.
Assessment_graph
Date
Agricultural cover

Number of administrative units classified as Warning (%)

Date
Cover
Date
Cover
WI_graph1
Date
Cover
WI_graph2
Date
Cover
Indicator
WI_graph3
Date
Cover
Indicator
Area
ASAP1 Units
Main indicators at dekad
Last 6 dekads for indicator
Date
Indicator
Date
Indicator
Date
Indicator
Date
Indicator
Date
Indicator
Date
Indicator
Phenology
Layer
Season progress
Dekad
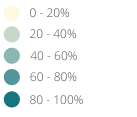
Agricultural area
Cover
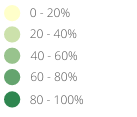
Warning frequency map
Cover
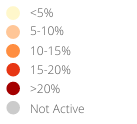
ASAP units
Selection of FAO crop calendars matching with ASAP phenology
CCP_graph1
Agriculture statistics: ten crops with largest area
CCP_graph2
Agriculture statistics: ten crops with largest production
CCP_graph3
Share of national cereal production by subnational units
CCP_graph4