Malawi
Assessments
March 2025
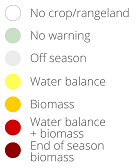
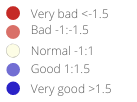
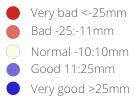
The 2023/2024 rainfall performance was erratic in the country. In the first part of the season (November-December 2024), rainfall was poor across the country. In the second part of the season (January-March), rainfall conditions have improved. In particular, cumulative rainfall in the last three months has been average to slgihlty above-average in the central and southern part of the country and slightly below-average in the northern part. As of 20 March, crop and rangeland conditions are below-average in the Central and Southern regions, as ca. 35%-45% of active crop area and ca. 35%-40% of active rangeland area are affected by a greenness anomaly. Crop and rangeland conditions faired better in the Northern region. ”. The Copernicus C3S Multimodel seasonal rainfall forecast for April 2025 points to average rainfall conditions in the southern part of the country, drier-than-average conditions in the central part and above-average in the northern part. Harvesting of the main season cereal crops is expected to start from late April and maize production is likely to be below-average in Southern and Central regions. According to FAO, Crop Prospects and Food Situation (March 2025) report, “cereal crops are not expected to fully recover from the negative effects on yields of the early-season dryness and production in 2025 is likely to remain at average to below-average levels. Moreover, localized outbreaks of Fall Army worm have also been reported in Malawi and are impairing yield prospects in heavily infested areas”. According to a report from OCHA, Tropical Cyclone Jude hit the country between 10 and 12 March, and nearly 20,650 people were affected (DoDMA). According to the same report, “the tropical storm impacted nine councils in the south (Nsanje, Neno, Blantyre District, Mwanza, Phalombe, Zomba City, Mangochi District, Thyolo, Mulanje), with Phalombe District recording the highest number of affected people (9,968), followed by Nsanje (2,637)”.
Hotspots Time Series
Assessment_graph
Country Summary
Statistics
Date
Agricultural cover
Number of administrative units classified as Warning (%)
Warnings and indicator graphs
Date
Cover
Date
Cover
WI_graph1
Date
Cover
WI_graph2
Date
Cover
Indicator
WI_graph3
Indicator temporal profile (ASAP units level 1)
Year
Cover
Indicator
Area
ASAP1 Units
Indicator maps
Main indicators at dekad
Last 6 dekads for indicator
Date
Indicator
Date
Indicator

Date
Indicator
Date
Indicator

Date
Indicator

Date
Indicator

Ancillary Information
Overview maps
Phenology
Layer

Season progress
Dekad
Agricultural area
Cover
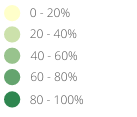
Warning frequency map
Cover
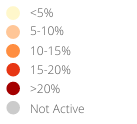
ASAP units
Crop calendar and Production
Selection of FAO crop calendars matching with ASAP phenology
CCP_graph1
Agriculture statistics: ten crops with largest area
CCP_graph2
Agriculture statistics: ten crops with largest production
CCP_graph3
Share of national cereal production by subnational units
CCP_graph4


