Menu
Close
Menu
Back
Home
Country Assessments
Seasonal Forecast
Africa
Asia
Europe
North America
South America
Oceania
Global
Warning Explorer
High Resolution Viewer
Hidden Link
Download
Info
News
Documentation
Change Log
About us
European Commission
EU Science HUB
ASAP
Country Assessment
Liberia
Assessments
September 2024
No hotspot
Not a hotspot country according to the latest ASAP analysis.
Assessment archive
Hotspots Time Series
Assessment_graph
Hotspots time series
Country Summary
Statistics
Date
Agricultural cover
Crop
Rangeland
Area statistics
Critical anomalies of key indicators
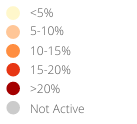
Number of administrative units classified as Warning
(
%)
Warnings and indicator graphs
Date
Cover
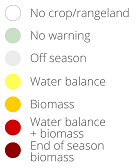
Crop
Rangeland
Warnings map
Date
Cover
Crop
Rangeland
WI_graph1
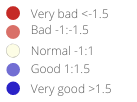
Share of active area by zscore range per indicator
Date
Cover
Crop
Rangeland
WI_graph2
Warnings time series
Date
Cover
Crop
Rangeland
Indicator
zFPARc
SPI1
SPI3
zFPAR
ztemperature
WSI_ASAP
WI_graph3
10 regions with the largest affected area according to the selected indicator (share of active area by zscore range)
Indicator temporal profile (ASAP units level 1)
Date
Cover
Crop
Rangeland
Indicator
FPAR/Rainfall
Temperature
Radiation
Area
All
Active
ASAP1 Units
Bomi
Bong
Gbarpolu
Grand Bassa
Grand Cape Mount
Grand Gedeh
Grand Kru
Lofa
Margibi
Maryland
Montserrado
Nimba
Rivercess
River Gee
Sinoe
Average temporal profile
Indicator maps
Main indicators at dekad
Update maps
Last 6 dekads for indicator
Update maps
Date
Indicator
Date
Indicator
Date
Indicator
Date
Indicator
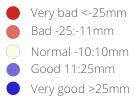
Date
Indicator
Date
Indicator
Ancillary Information
Overview maps
Phenology
Layer
Number of seasons
Start of first season
End of first season
Length of first season
Start of second season
End of second season
Length of second season
Season progress
Dekad
Agricultural area
Cover
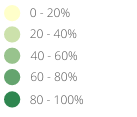
Crop
Rangeland
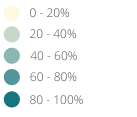
Warning frequency map
Cover
Crop
Rangeland
ASAP units
Crop calendar and Production
Selection of FAO crop calendars matching with ASAP phenology
CCP_graph1
Agriculture statistics: ten crops with largest area
CCP_graph2
Agriculture statistics: ten crops with largest production
CCP_graph3
Share of national cereal production by subnational units
CCP_graph4
Integrated Food Security Phase Classification (IPC)/Cadre Harmonisé (CH)
Total # (pp)
Phase 1
Phase 2
Phase 3
Phase 4
Phase 5
P3+
Period from
Period to
#
%
#
%
#
%
#
%
#
%
#
%